
Jamming and spoofing of satellite signals stopped being a topic only for defence analysts some time ago. GNSS disruption around the Baltic, the Middle East and the Black Sea now routinely affects civil aviation, and the consequence is always the same: a system that has been taken for granted for decades suddenly becomes unreliable. The question left over is how long, and how accurately, a platform can keep track of where it is.
One recent set of flight tests offers an unusually concrete answer. In July 2026, Inertial Labs published results from a campaign of eighteen flights in which satellite reception was deliberately switched off and navigation was handed over to an inertial system aided by cameras. The data is public and detailed enough to support conclusions that reach beyond any one product.
Why inertial sensors alone are not enough
An inertial measurement unit senses its own acceleration and angular rate. Integrate those and you get velocity, integrate again and you get position. The method is elegant because it depends on nothing external — which is also exactly why it cannot correct itself. Every small sensor error enters the integration and stays there, so the deviation accumulates. With cheaper MEMS sensors that run to tens of metres per minute; with higher-grade optical gyros it is slower, but the principle is identical.
In practice this means a pure inertial system comfortably covers a dropout of a few tens of seconds and copes badly with a dropout of half an hour. Any mission longer than that needs an external source of absolute position that does not come from a satellite.
The approach: treat the terrain as the map
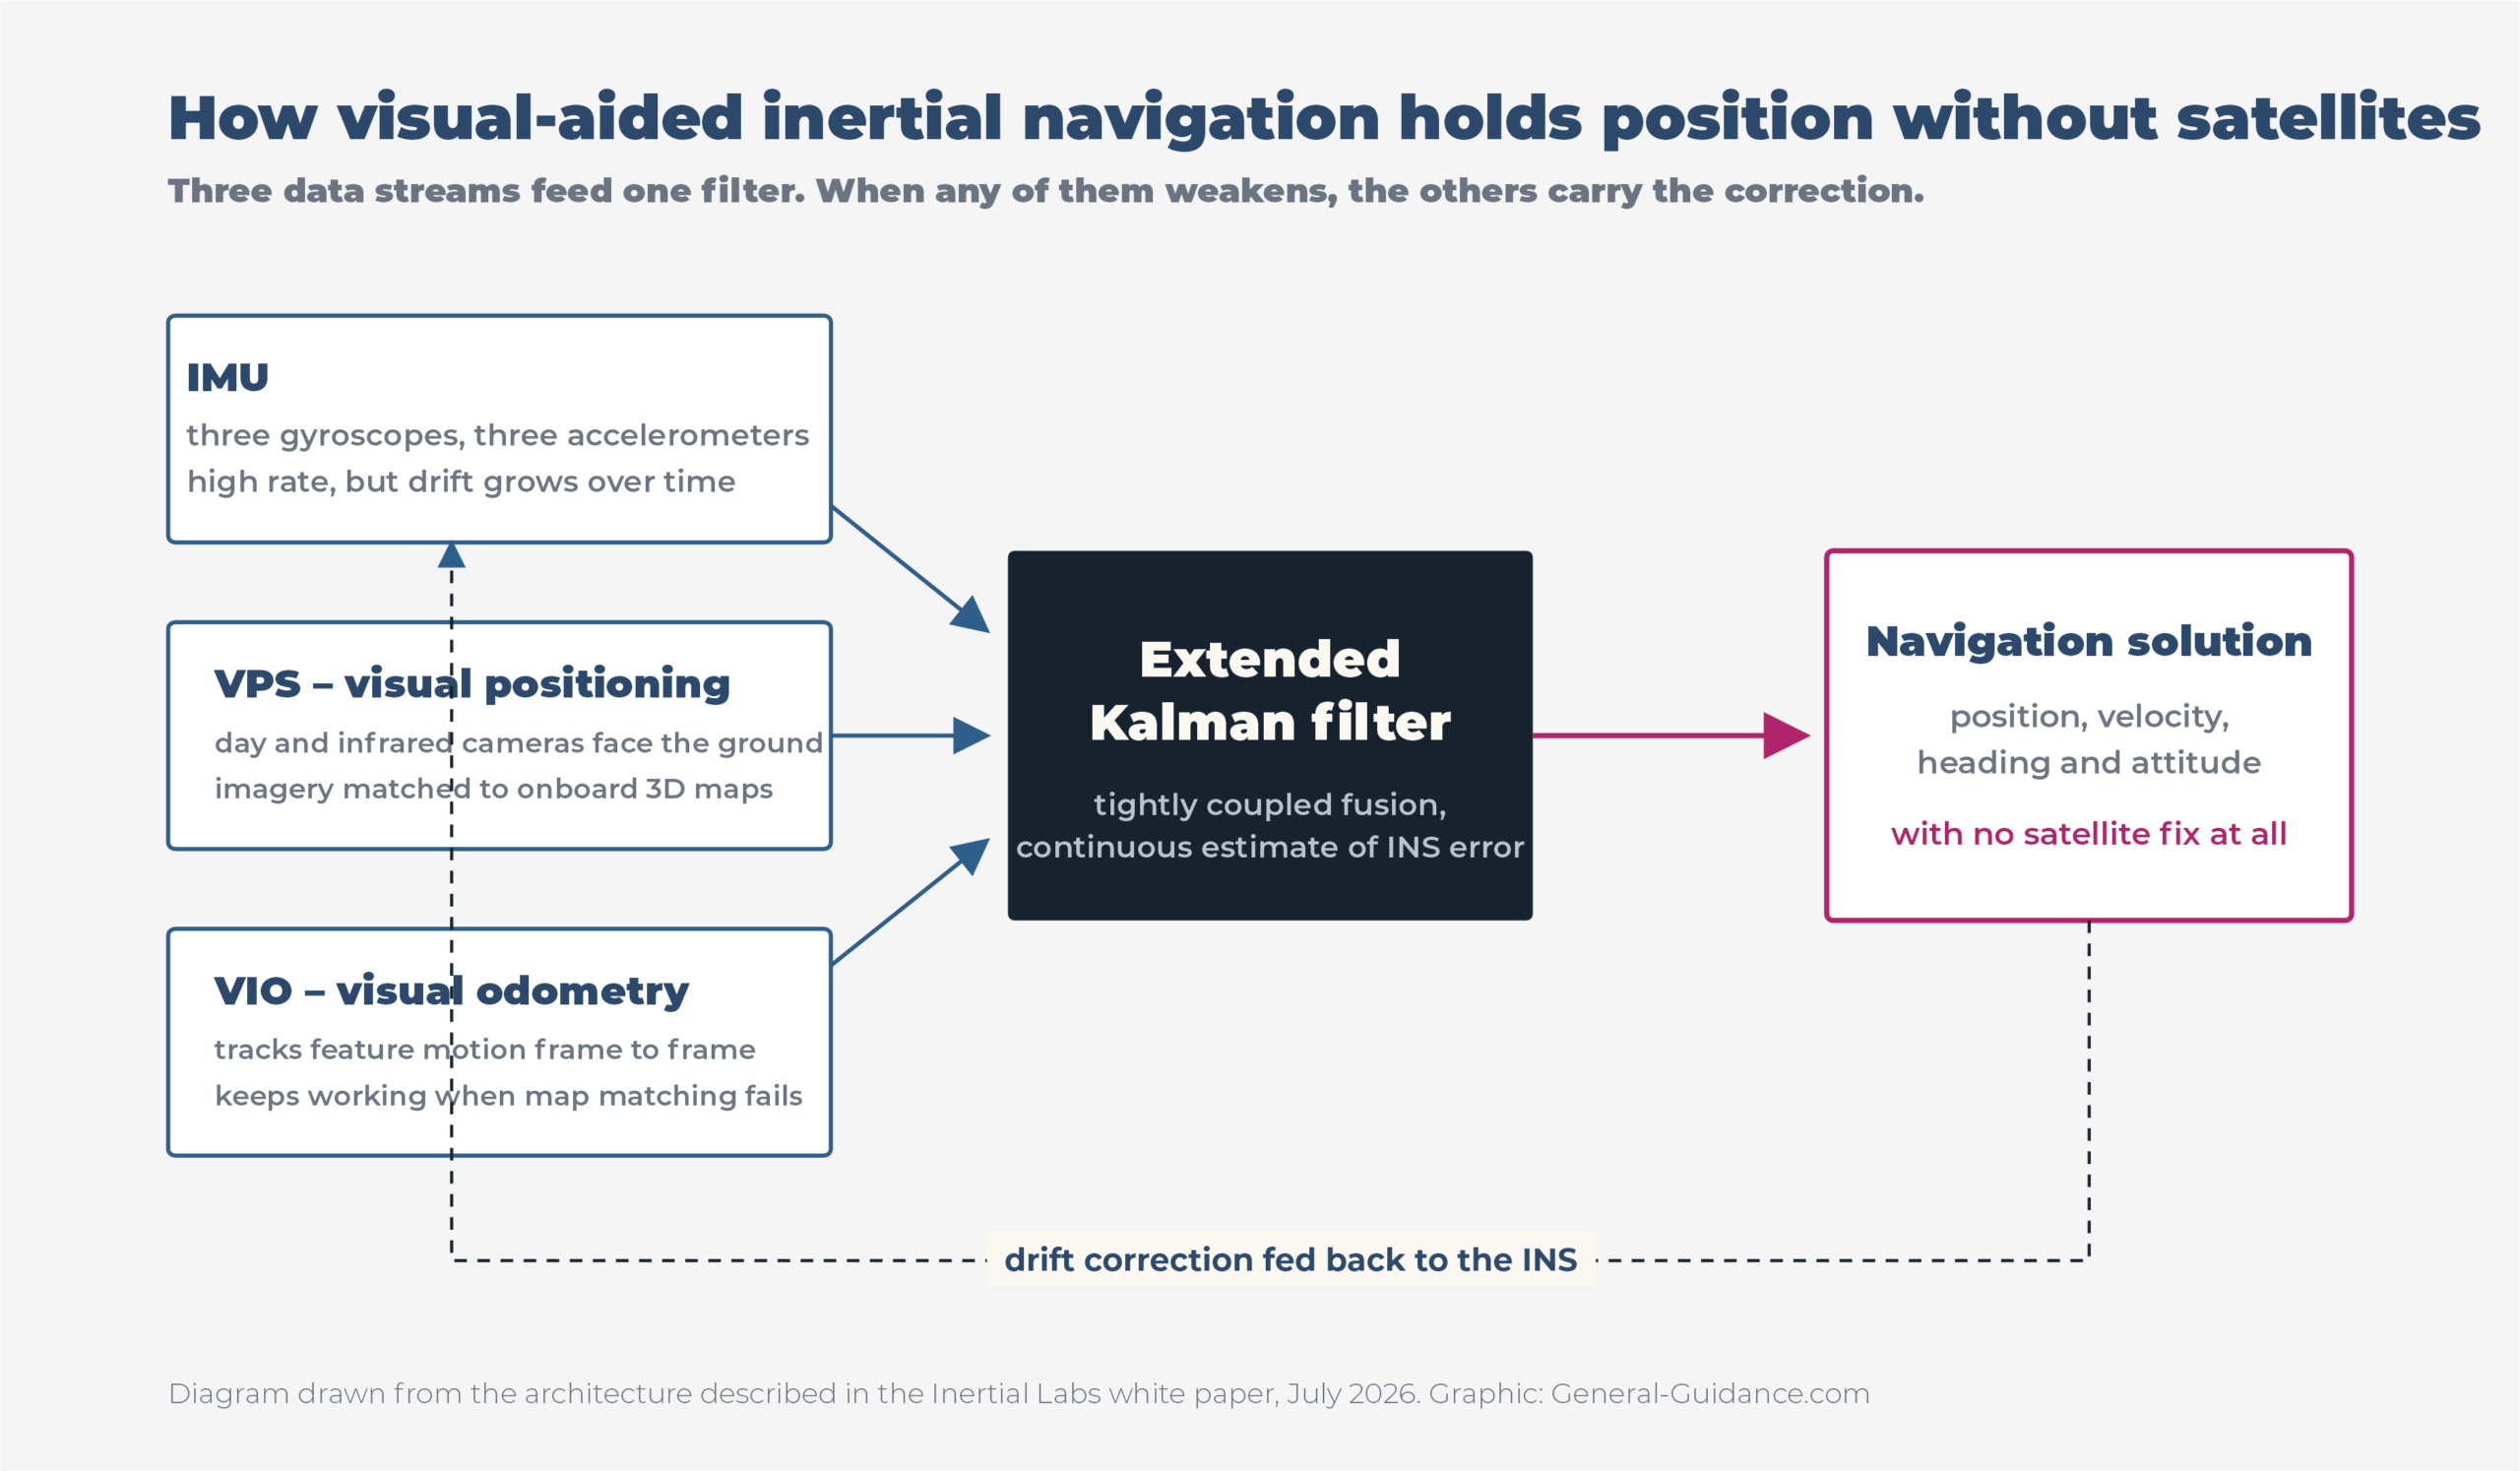
The architecture under test combines three data streams. The inertial unit still carries the continuity of the solution. Alongside it run two visual components: a visual positioning system, which compares live camera imagery against a pre-loaded three-dimensional satellite map of the terrain and derives an absolute position from the match, and visual inertial odometry, which tracks how distinctive features move through the frame and computes relative motion from that.
All three are combined in an extended Kalman filter that continuously estimates the error in the inertial solution and corrects it. The division of labour is sensible: where the terrain carries enough recognisable features, visual positioning supplies an absolute correction; where map matching weakens — over monotonous fields, over water, in poor light — odometry maintains continuity until conditions improve.
How it was tested
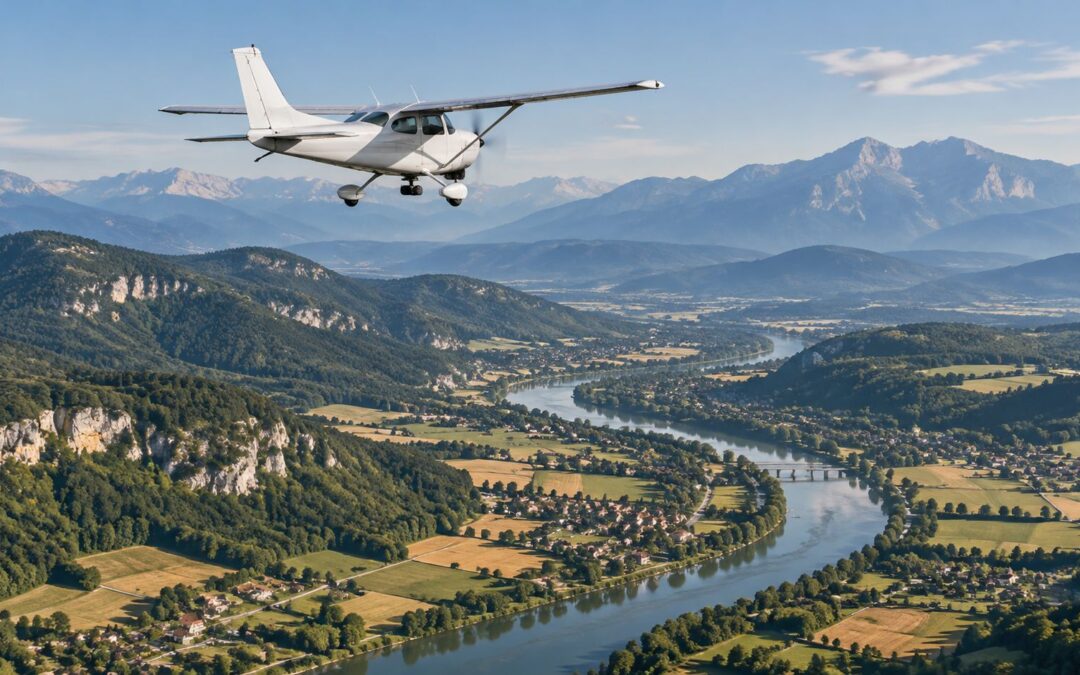
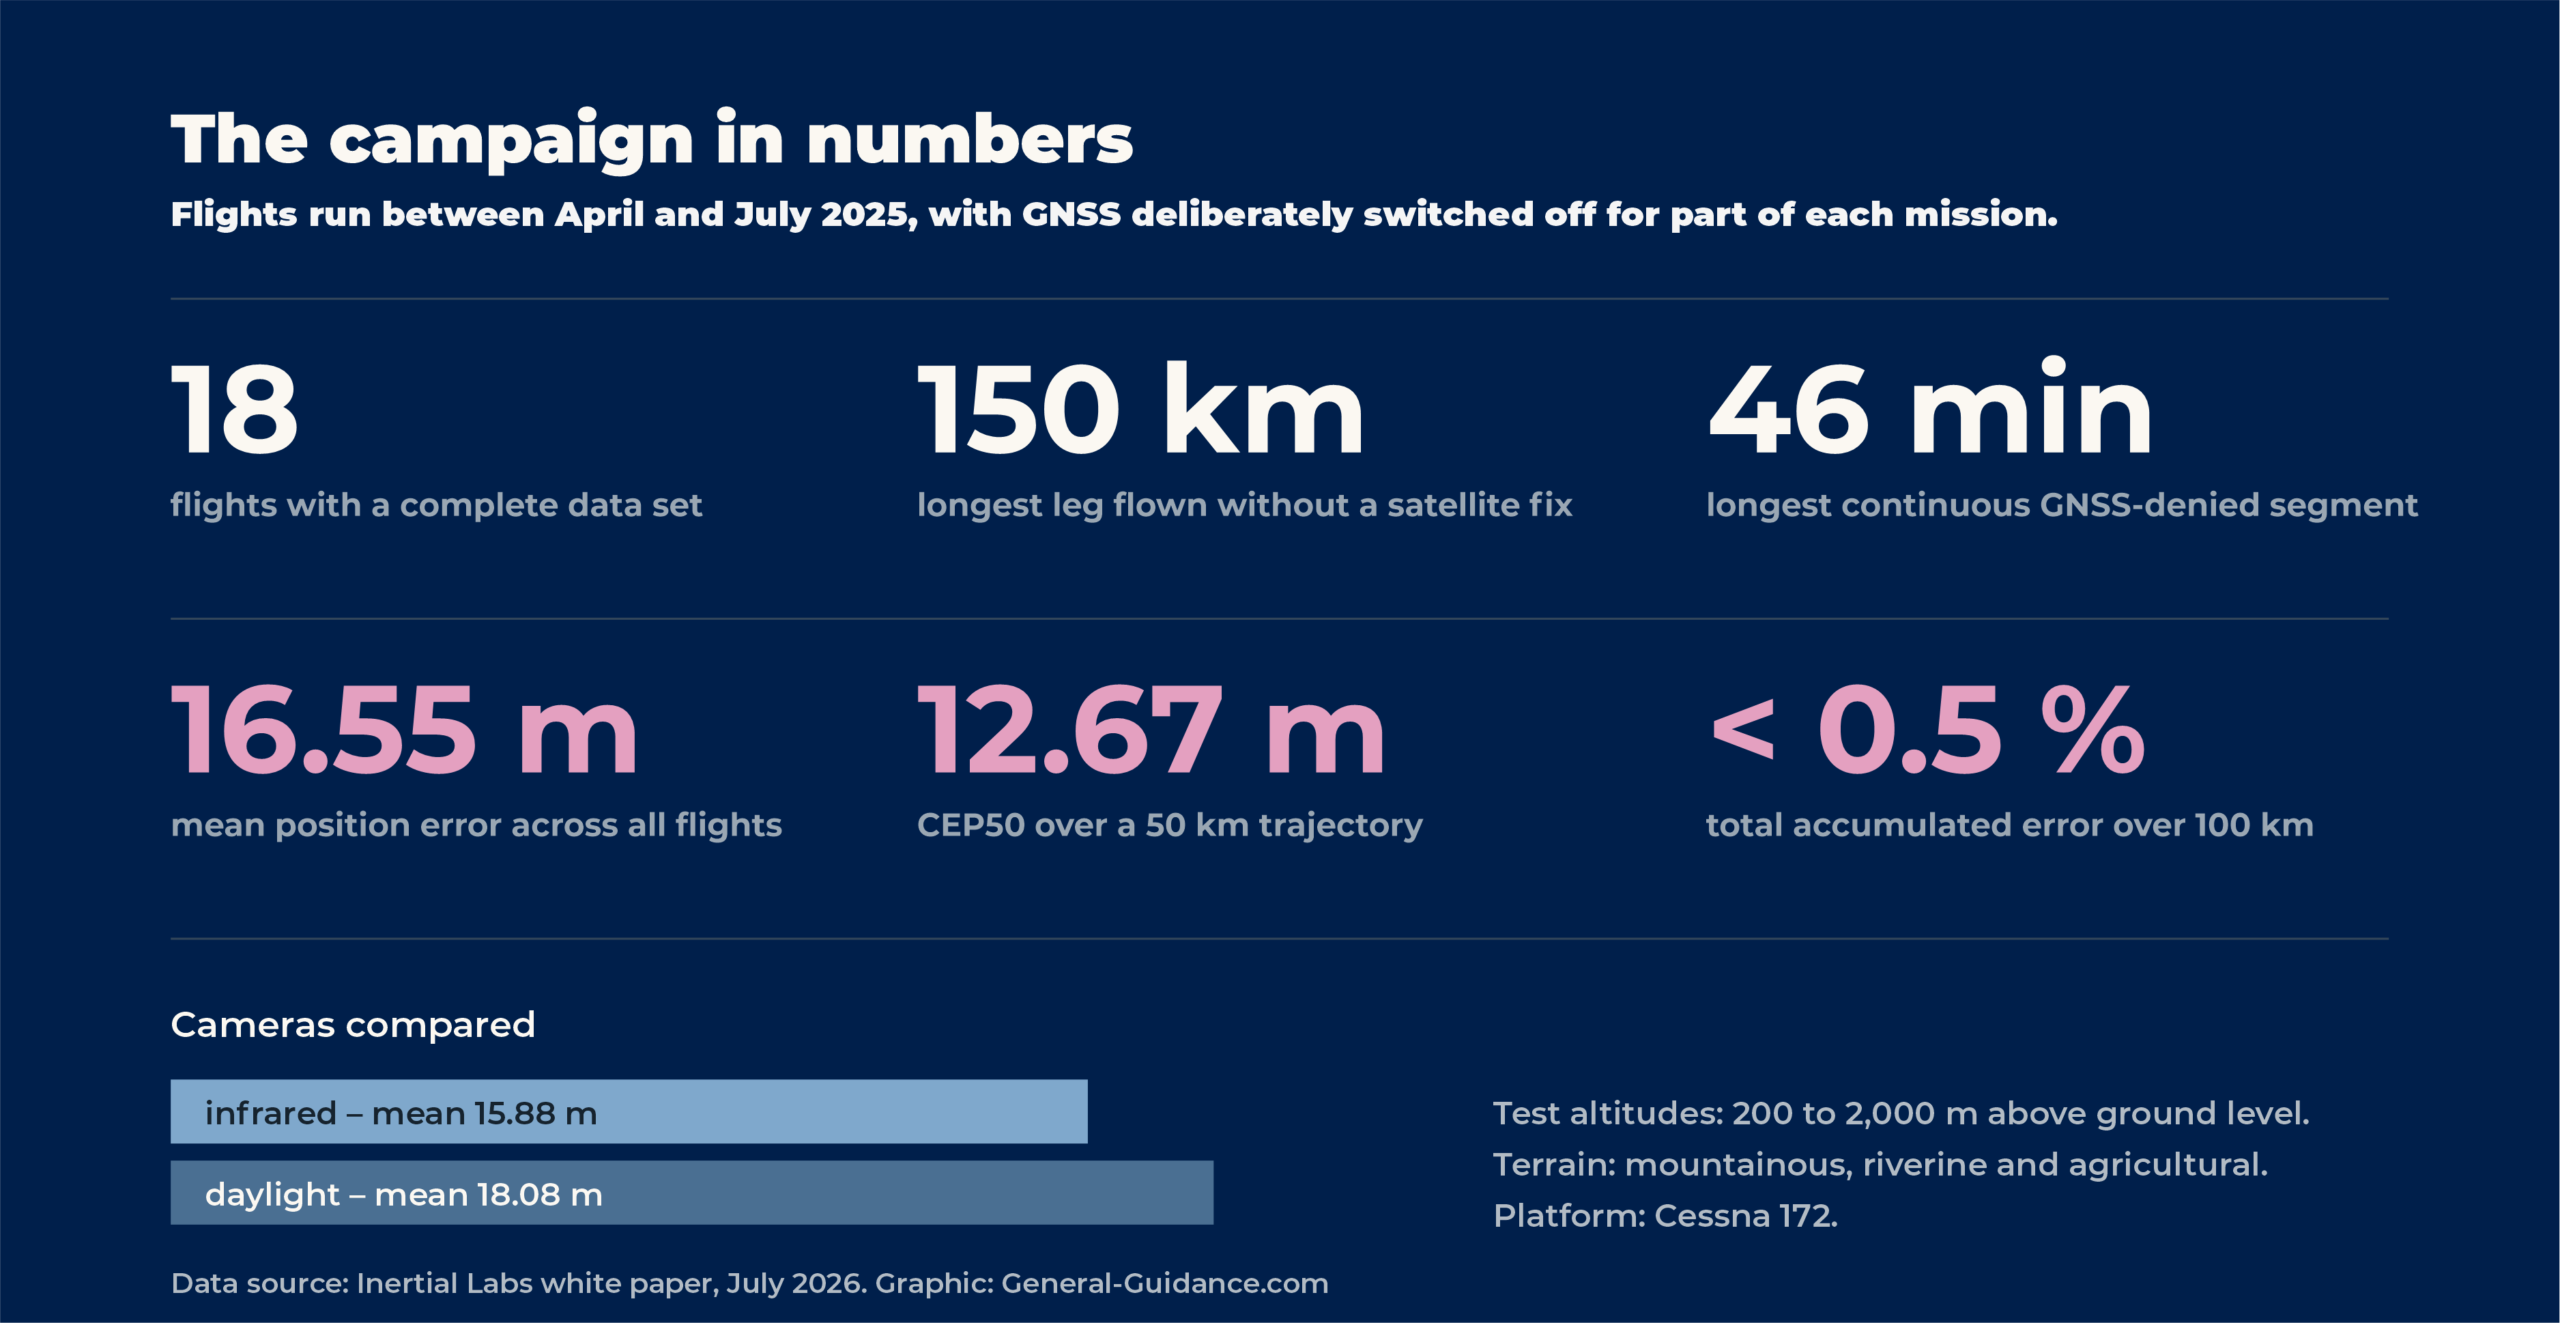
The carrier was a Cessna 172, which is a meaningful detail: this is an ordinary light platform rather than a purpose-built airframe. Eighteen complete data sets were gathered between April and July 2025. Satellite reception was disabled for segments lasting up to 46 minutes and covering up to 150 kilometres of track. Flight altitudes ranged from 200 to 2,000 metres above ground level, and routes were deliberately flown across different landscape types — mountainous, riverine and agricultural. Both a daylight and an infrared camera were evaluated.
The results
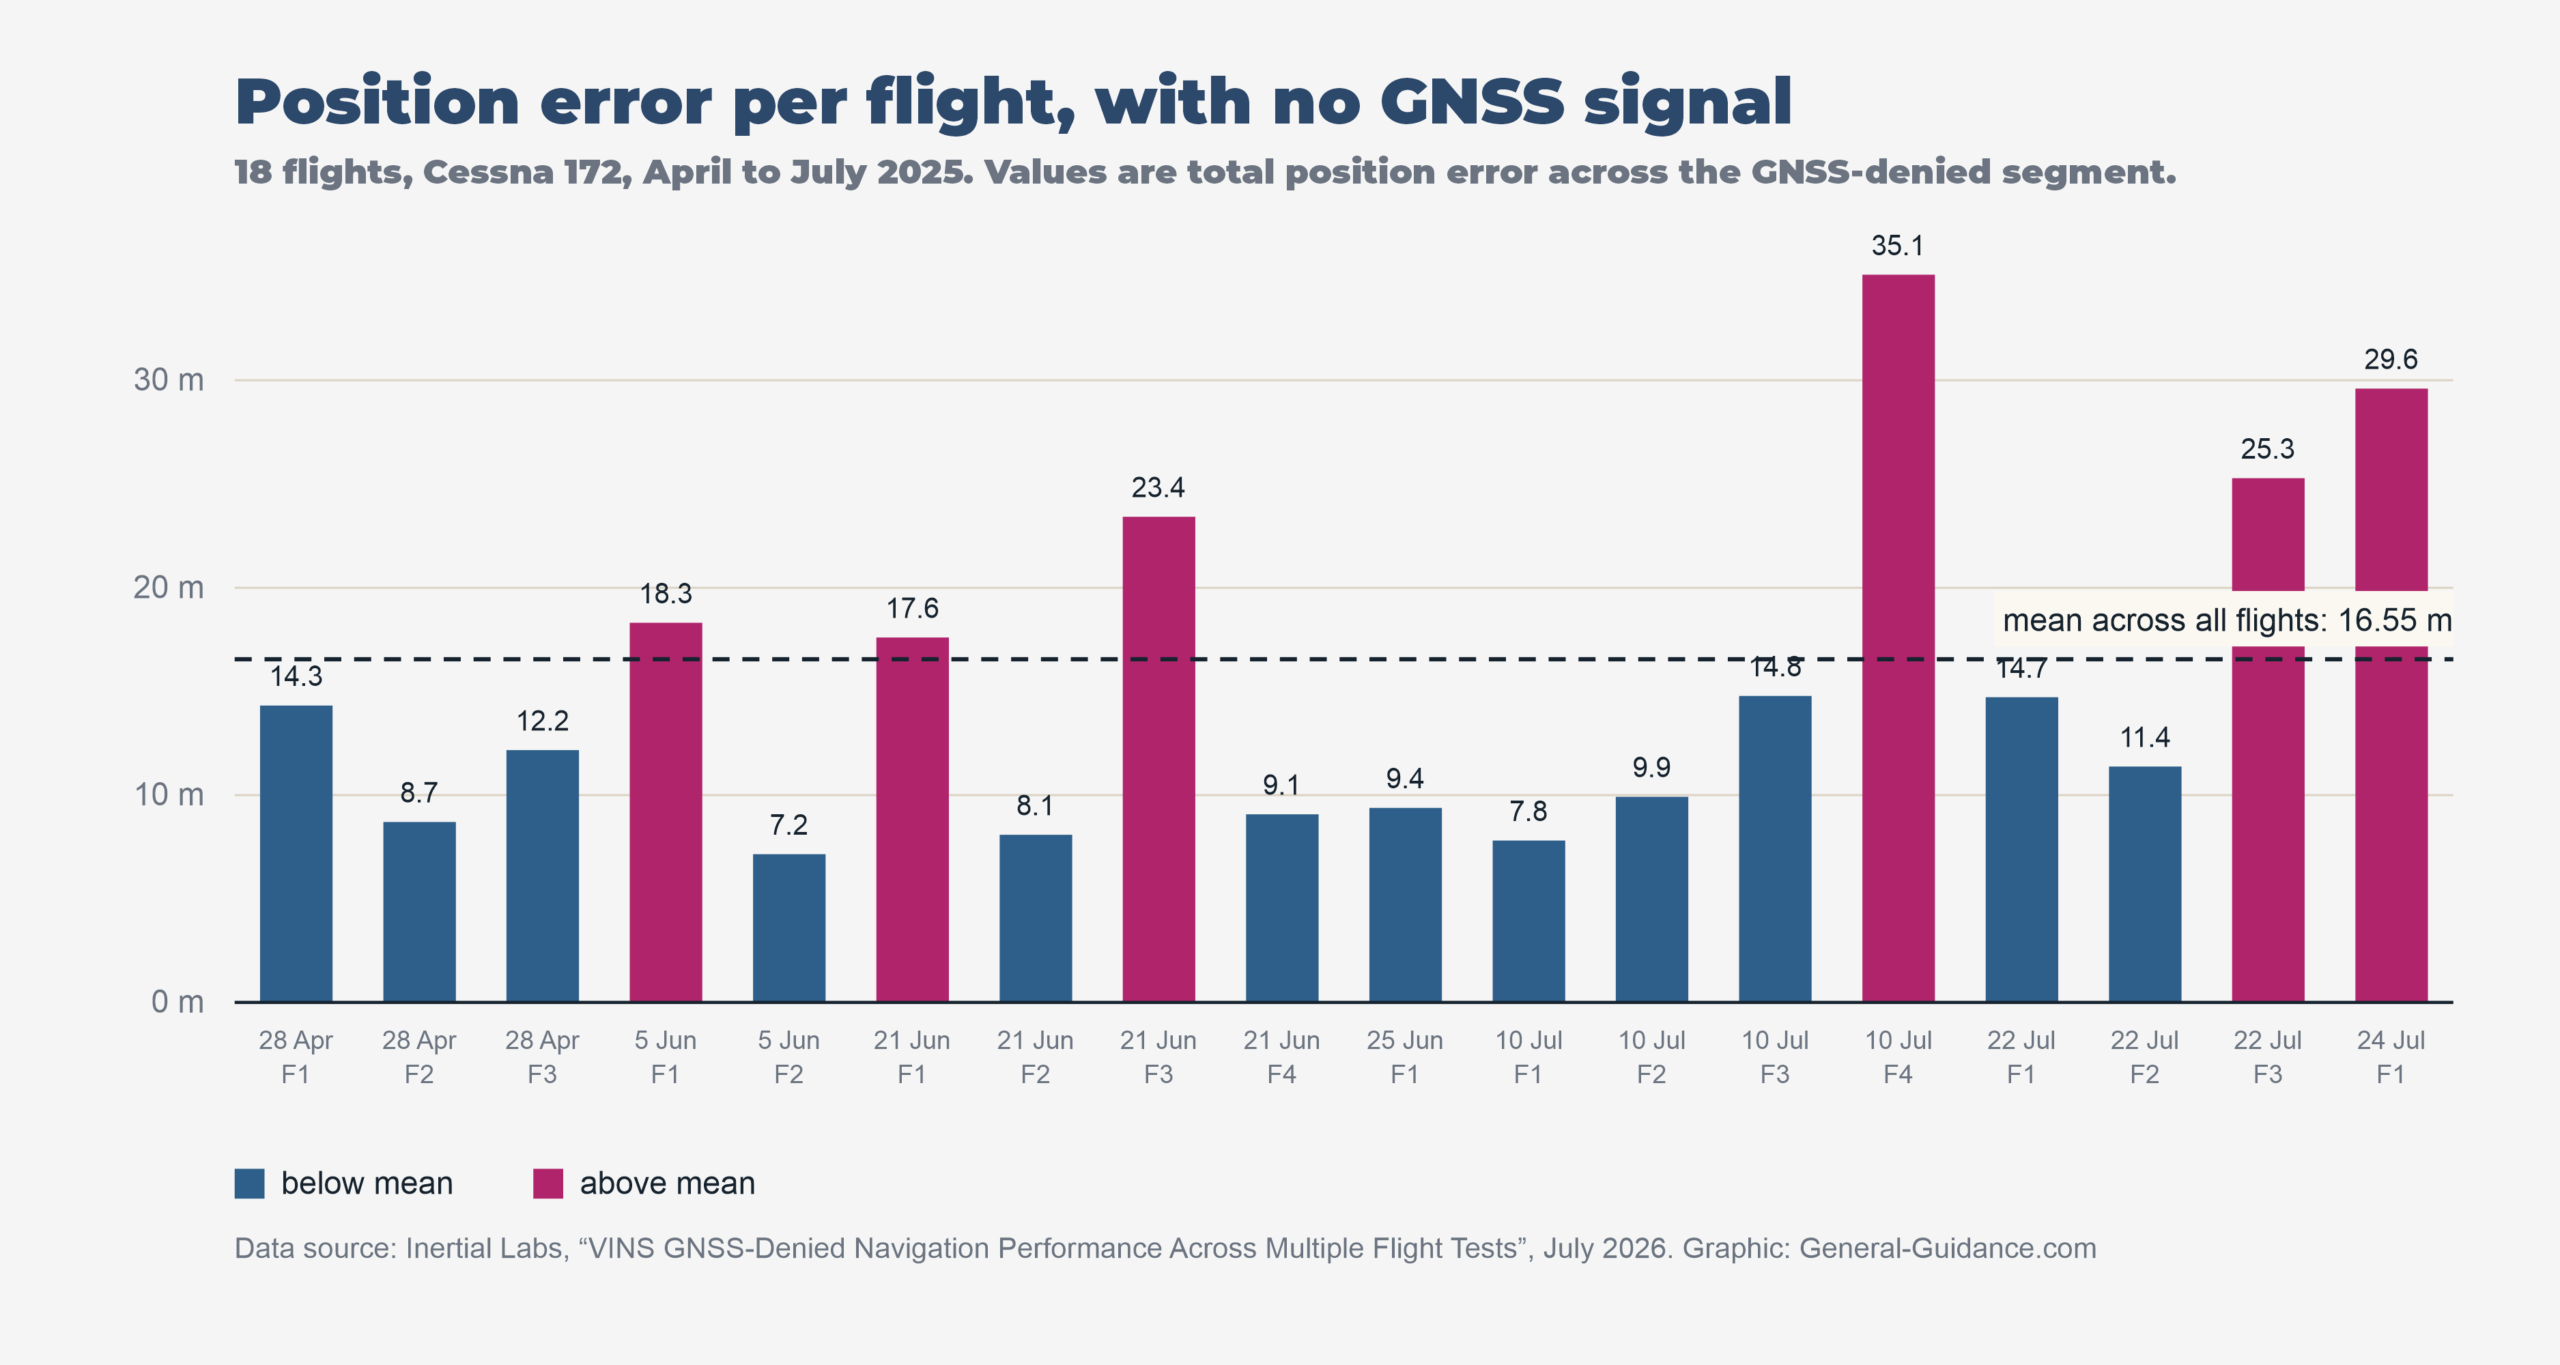
Mean position error across all flights came to 16.55 metres. The spread is more informative than the average, though: the best flight finished with 7.15 metres of deviation, the worst with 35.09.
Expressed as CEP50 over a 50-kilometre trajectory, the result was 12.67 metres — half of all position estimates stayed inside a circle of that radius. Error per distance travelled held below 0.2 per cent on most flights, and total accumulated deviation never exceeded 0.5 per cent over 100 kilometres.
One finding worth pausing on is that the infrared camera consistently beat the daylight one: a mean of 15.88 against 18.08 metres. The likely explanation is that thermal contrast depends less on time of day and atmospheric conditions than visible contrast does, so it remains a steadier source of features for map matching.
What these numbers actually mean
They are worth putting in context. Uncorrected inertial navigation over a 150-kilometre leg, with sensors of this class, would finish with an error in the hundreds of metres to several kilometres. Holding deviation under twenty metres over the same distance is therefore an order-of-magnitude improvement.
On the other hand, it remains far from differential GNSS precision, which is measured in centimetres. For flying a route, for bringing a platform back to a known point, or for coarse cueing of sensor collection, an error of fifteen metres or so is entirely usable. For precision measurement, automated landing or survey work, it is not.
Two limitations follow from the method itself. First, the system depends on a map of the terrain being prepared in advance; without one, only odometry remains, and that drifts on its own over time. Second, the results were obtained over terrain with clear features. Over open sea, desert, snow cover or a thick cloud layer, visual matching has nothing to anchor to, and noticeably weaker figures should be expected.
Finally, the source of the data is the equipment manufacturer rather than an independent laboratory. That does not make the measurements wrong — publishing a per-flight table that includes the weakest results inspires more confidence than the usual marketing summary. But the methodology has not been peer reviewed or reproduced by a third party, so the numbers are best read as a well-documented finding from one campaign rather than a standardised specification.
Conclusion
What these tests demonstrate is not that a replacement for satellite navigation has been found. They show something more modest and more practically useful: that fusing several independent data sources turns the loss of GNSS from a mission abort into a degradation in performance. The platform is not left without a position — it is left with a worse position, which is still good enough to finish the job.
In an environment where jamming has become routine, that is the difference that decides the outcome.
General Guidance distributes Inertial Labs inertial navigation solutions worldwide – contact us to discuss your platform’s requirements.
Frequently Asked Questions
How accurate is navigation without GPS?
In this campaign, a visually aided inertial system held a mean position error of 16.55 metres across eighteen flights, including legs of up to 150 kilometres with no satellite fix. Accuracy depends heavily on the sensor grade and on whether the terrain below offers features the cameras can match against a map.
What does CEP50 mean?
CEP50, or circular error probable, is the radius of a circle containing half of all position estimates. A CEP50 of 12.67 metres means that fifty per cent of the time the reported position was within 12.67 metres of the true one.
Why does an inertial navigation system drift?
It works by integrating measured acceleration and rotation over time. Every small sensor bias is integrated along with the real signal and never cancels out, so error accumulates and grows the longer the system runs without an external correction.